MA Cross MTF Alert (Miu)This script extends the classic moving average crossover strategy with support for up to 8 user-defined symbols across 4 custom timeframes, combined with a visual and alert system designed for traders who monitor multiple assets simultaneously.
Unlike traditional MA crossover tools, this script enables traders to receive real-time alerts for crossovers across multiple assets and timeframes, even when the script is not actively displayed on the chart — ideal for passive monitoring in multi-asset strategies.
What it does:
This script calculates two customizable moving averages (SMA or EMA) for each selected symbol and timeframe.
It then tracks crossover events:
- Bullish crossover when the fast MA crosses above the slow MA
- Bearish crossunder when the fast MA crosses below the slow MA
On the chart, it also displays the crossover signals for the current symbol and timeframe using color-coded cross icons.
Key features:
- Select SMA or EMA type for both moving averages
- Customize MA lengths and colors
- Works with any asset and timeframe
- Alerts include symbol and timeframe info for easy identification
How to use:
1) Add the indicator to your chart.
2) Choose the moving average type and lengths.
3) Enable/disable any of the 8 symbols and 4 timeframes.
4) Set up TradingView alerts by clicking “Create Alert” and selecting one of the alert() calls.
5) You will receive a message like:
BTC (1h) | MA Crossover ▲ or ETH (15m) | MA Crossunder ▼
Technical note:
This script uses request.security() to retrieve moving average values from up to 8 different symbols and 4 different timeframes in real time.
Feel free to leave your feedback or suggestions in the comments section below.
Enjoy!
Cari skrip untuk "moving average crossover"

5x MA "Crossover" by Southnjes5 x Simple Moving average crossover script. 10/20/50/100/200. Clearly shows when your moving averages cross over each other.
Allows you to have multiple crossover indications for different MA's. Just turn on and off for moving averages and the respective crossovers which you want to see.
Great for free users as it allows you to have multiple crossovers on a single chart taking up only one slot of your 3 available.
Why I like it? Well, for me, it perfectly presented the impending issue with the potential BTC drop for NOV 2018 with the long term MA's moving down and crossing the short term MA's. (I got out). :)
Hope this helps some of you.

(DAFE) DEVMA - Crossover (Deviation Moving Average) (DAFE) DEVMA - Crossover (Deviation Moving Average)
Let’s keep pushing the edge. After the breakthrough of Deviation over Deviation (DoD)—which gave traders a true lens into volatility’s hidden regime shifts—many asked: “What’s next?” The answer is DEVMA: a crossover engine built not on price, but on the heartbeat of the market itself.
Why is this different?
DEVMA isn’t just a moving average crossover. It’s a regime detector that tracks the expansion and contraction of deviation—giving you a real-time readout of when the market’s energy is about to shift. This is the next step for anyone who wants to anticipate volatility, not just react to it.
What sets DEVMA apart:
Volatility-First Logic:Both fast and slow lines are moving averages of deviation, not price. You’re tracking the market’s “energy,” not just its direction. This is the quant edge that most scripts miss.
Regime-Colored Lines:
The fast and slow DEVMA lines change color in real time—green/aqua for expansion, maroon/orange for contraction—so you can see regime shifts at a glance.
Quant-Pro Visuals:
Subtle glow, clean cross markers, and a minimalist dashboard keep your focus on what matters: the regime, not the noise.
Static Regime Thresholds:
Reference lines at 1.5 and 0.5 (custom colors) give you instant context for “normal” vs. “extreme” volatility states.
No Price Chasing:
This isn’t about following price. It’s about anticipating the next volatility regime—before the crowd even knows what’s coming.
How this builds on DoD:
DoD showed you when volatility itself was about to change. DEVMA takes that insight and turns it into a crossover engine—so you can see, filter, and act on regime shifts in real time. If DoD was the radar, DEVMA is the navigation system.
Inputs/Signals—explained for clarity:
Deviation Lookback:
Controls the sensitivity of the regime detector. Shorter = more signals, longer = only the rarest events.
Fast/Slow DEVMA Lengths:
Fine-tune how quickly the regime lines react. Fast for scalping, slow for swing trading.
Source Selection:
Choose from price, volume, volatility, or VoVix. Each source gives you a different lens on market stress. VoVix is for those who want to see the “regime quake” before the aftershocks.
VoVix Parameters:
Fine-tune the volatility-of-volatility engine for your market. Lower ATR Fast = more responsive; higher ATR Slow = more selective.
Bottom line:
DEVMA is for those who want to see the market’s heartbeat, not just its shadow. Use it to filter your trades, time your entries, or simply understand the market’s true rhythm. Every input is there for a reason. Every plot is a direct readout of the quant logic. Use with discipline, and make it your own.
Disclaimer:
Trading is risky. This script is for research and informational purposes only, not financial advice. Backtest, paper trade, and know your risk before going live. Past performance is not a guarantee of future results.
*Updated the Dashboard/Metrics Display for better visibility
Use with discipline. Trade your edge.
— Dskyz, for DAFE Trading Systems

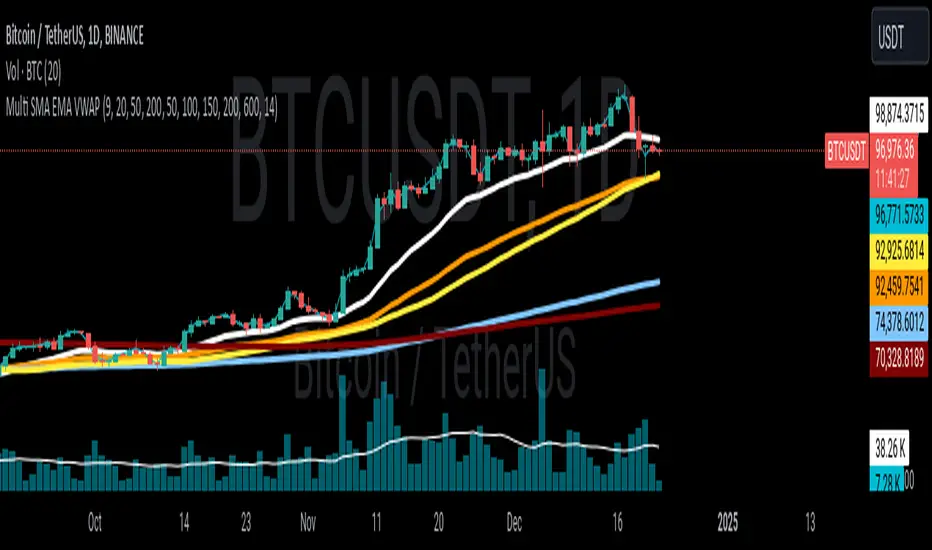
Multi SMA EMA VWAP1. Moving Average Crossover
This is one of the most common strategies with moving averages, and it involves observing crossovers between EMAs and SMAs to determine buy or sell signals.
Buy signal: When a faster EMA (like a short-term EMA) crosses above a slower SMA, it can indicate a potential upward movement.
Sell signal: When a faster EMA crosses below a slower SMA, it can indicate a potential downward movement.
With 4 EMAs and 5 SMAs, you can set up crossovers between different combinations, such as:
EMA(9) crosses above SMA(50) → buy.
EMA(9) crosses below SMA(50) → sell.
2. Divergence Confirmation Between EMAs and SMAs
Divergence between the EMAs and SMAs can offer additional confirmation. If the EMAs are pointing in one direction and the SMAs are still in the opposite direction, it is a sign that the movement could be stronger and continue in the same direction.
Positive divergence: If the EMAs are making new highs while the SMAs are still below, it could be a sign that the market is in a strong trend.
Negative divergence: If the EMAs are making new lows and the SMAs are still above, you might consider that the market is in a downtrend or correction.
3. Using EMAs as Dynamic Support and Resistance
EMAs can act as dynamic support and resistance in strong trends. If the price approaches a faster EMA from above and doesn’t break it, it could be a good entry point for a long position (buy). If the price approaches a slower EMA from below and doesn't break it, it could be a good point to sell (short).
Buy: If the price is above all EMAs and approaches the fastest EMA (e.g., EMA(9)), it could be a good buy point if the price bounces upward.
Sell: If the price is below all EMAs and approaches the fastest EMA, it could be a good sell point if the price bounces downward.
4. Combining SMAs and EMAs to Filter Signals
SMAs can serve as a trend filter to avoid trading in sideways markets. For example:
Bullish trend condition: If the longer-term SMAs (such as SMA(100) or SMA(200)) are below the price, and the shorter EMAs are aligned upward, you can look for buy signals.
Bearish trend condition: If the longer-term SMAs are above the price and the shorter EMAs are aligned downward, you can look for sell signals.
5. Consolidation Zone Between EMAs and SMAs
When the price moves between EMAs and SMAs without a clear trend (consolidation zone), you can expect a breakout. In this case, you can use the EMAs and SMAs to identify the direction of the breakout:
If the price is in a narrow range between the EMAs and SMAs and then breaks above the fastest EMA, it’s a sign that an upward trend may begin.
If the price breaks below the fastest EMA, it could indicate a potential downward trend.
6. "Golden Cross" and "Death Cross" Strategy
These are classic strategies based on crossovers between moving averages of different periods.
Golden Cross: Occurs when a faster EMA (e.g., EMA(50)) crosses above a slower SMA (e.g., SMA(200)), which suggests a potential bullish trend.
Death Cross: Occurs when a faster EMA crosses below a slower SMA, which suggests a potential bearish trend.
Additional Recommendations:
Combining with other indicators: You can combine EMA and SMA signals with other indicators like the RSI (Relative Strength Index) or MACD (Moving Average Convergence/Divergence) for confirmation and to avoid false signals.
Risk management: Always use stop-loss and take-profit orders to protect your capital. Moving averages are trend-following indicators but don’t guarantee that the price will move in the same direction.
Timeframe analysis: It’s recommended to use different timeframes to confirm the trend (e.g., use EMAs on hourly charts along with SMAs on daily charts).
VWAP
1. VWAP + EMAs for Trend Confirmation
VWAP can act as a trend filter, confirming the direction provided by the EMAs.
Buy Signal: If the price is above the VWAP and the EMAs are aligned in an uptrend (e.g., short-term EMAs are above longer-term EMAs), this indicates that the trend is bullish and you can look for buy opportunities.
Sell Signal: If the price is below the VWAP and the EMAs are aligned in a downtrend (e.g., short-term EMAs are below longer-term EMAs), this suggests a bearish trend and you can look for sell opportunities.
In this case, VWAP is used to confirm the overall trend. For example:
Bullish: Price above VWAP, EMAs aligned to the upside (e.g., EMA(9) > EMA(50) > EMA(200)), buy.
Bearish: Price below VWAP, EMAs aligned to the downside (e.g., EMA(9) < EMA(50) < EMA(200)), sell.
2. VWAP as Dynamic Support and Resistance
VWAP can act as a dynamic support or resistance level during the day. Combining this with EMAs and SMAs helps you refine your entry and exit points.
Support: If the price is above VWAP and starts pulling back to VWAP, it could act as support. If the price bounces off the VWAP and aligns with bullish EMAs (e.g., EMA(9) crossing above EMA(50)), you can consider entering a buy position.
Resistance: If the price is below VWAP and approaches VWAP from below, it can act as resistance. If the price fails to break through VWAP and aligns with bearish EMAs (e.g., EMA(9) crossing below EMA(50)), it could be a good signal for a sell.
Jobinsabu014This Pine Script code is for an advanced trading indicator that displays enhanced moving averages with buy and sell labels, trend probability, and support/resistance levels. Here’s a detailed description of its components and functionality:
### Description:
1. **Indicator Initialization**:
- The indicator is named "Enhanced Moving Averages with Buy/Sell Labels and Trend Probability" and is set to overlay on the chart.
2. **Input Parameters**:
- **Moving Averages**: Four different moving averages (short and long periods for default and enhanced) with customizable periods.
- **Probability Threshold**: Determines the threshold for trend probability.
- **Support/Resistance Lookback**: Number of bars to look back for calculating support and resistance levels.
- **Signals Valid From**: Timestamp from which the signals are considered valid.
3. **Moving Averages Calculation**:
- **Default Moving Averages**: Calculated using simple moving averages (SMA) for the specified periods.
- **Enhanced Moving Averages**: Calculated using SMAs for different specified periods.
4. **Plotting Moving Averages**:
- Plots the default and enhanced moving averages with different colors for distinction.
5. **Crossover Detection**:
- Detects when the short moving average crosses above or below the long moving average for default moving averages.
6. **Buy/Sell Signal Labels**:
- Adds "BUY" and "SELL" labels on the chart when crossovers are detected after the specified valid timestamp.
- Tracks entry prices for buy/sell signals and adds labels when the price moves +100 points.
7. **Trend Detection for Enhanced Indicator**:
- Detects uptrend or downtrend based on the enhanced moving averages.
- Calculates a simple probability of trend based on price movement and EMA.
- Determines buy and sell signals based on trend conditions and volume-based buy/sell pressure.
8. **Plot Buy/Sell Signals for Enhanced Indicator**:
- Plots buy/sell signals based on the enhanced conditions.
9. **Background Color for Trends**:
- Changes the background color to green for uptrend and red for downtrend.
10. **Trend Lines**:
- Draws imaginary trend lines for uptrend and downtrend based on enhanced moving averages.
11. **Support and Resistance Levels**:
- Calculates and plots support and resistance levels using the specified lookback period.
- Stores and plots previous support and resistance levels with dashed lines.
12. **Expected Trend Labels**:
- Adds labels indicating expected uptrend or downtrend based on buy/sell signals.
13. **Alerts**:
- Sets alert conditions for buy and sell signals, triggering alerts when these conditions are met.
14. **Demand and Supply Zones**:
- Draws and extends horizontal lines for demand (support) and supply (resistance) zones.
### Summary:
This script enhances traditional moving average crossovers by adding trend probability calculations, volume-based pressure, and support/resistance levels. It visualizes expected trends and provides comprehensive buy/sell signals with corresponding labels, background color changes, and alerts to help traders make informed decisions.

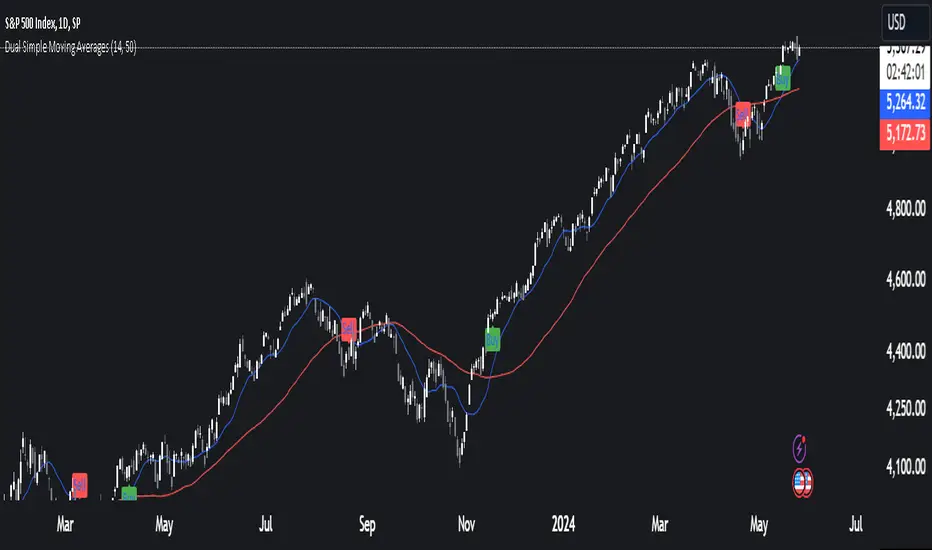
Dual Simple Moving Average with Price ConditionThe "Dual Simple Moving Average with Price Condition" indicator is a powerful tool designed to help traders identify potential buy and sell opportunities by analyzing the relationship between two Simple Moving Averages (SMAs) and the price action.
Features:
Simple Moving Averages (SMAs):
The indicator uses two SMAs: a short-term SMA and a long-term SMA.
The lengths of these SMAs can be customized to suit the trader’s preferences and trading style.
Crossover Signals:
Buy signals are generated when the short-term SMA crosses above the long-term SMA.
Sell signals are generated when the short-term SMA crosses below the long-term SMA.
Price Condition:
To enhance the reliability of the signals, the indicator includes a price condition:
A buy signal is only confirmed if, at the time of the crossover, the closing price is at its maximum over a specified period.
A sell signal is only confirmed if, at the time of the crossover, the closing price is at its minimum over a specified period.
The period for determining the maximum and minimum price can be customized by the user.
Visual Alerts:
Green "Buy" labels are displayed below the bars when a buy signal is confirmed.
Red "Sell" labels are displayed above the bars when a sell signal is confirmed.
How to Use:
Adjust the Inputs:
Customize the lengths of the short-term and long-term SMAs according to your trading strategy.
Set the period over which to evaluate the maximum and minimum prices.
Interpret the Signals:
Use the crossover of the short-term and long-term SMAs as the primary signal.
Confirm the signal by checking if the price condition is met (price at its maximum or minimum for the specified period).
Trade Entry and Exit:
Enter a long position when a green "Buy" label appears below the bar.
Enter a short position or exit a long position when a red "Sell" label appears above the bar.
Trading Tip: You can use the indicator best in higher timeframes, such as 4-hour (4H) and daily charts, along with a trend line. This approach helps to avoid false signals that may occur due to frequent crossings of the short and long-term SMAs on lower timeframes.
This indicator is suitable for various financial instruments including stocks, forex, commodities, and cryptocurrencies. By combining moving average crossovers with price conditions, it provides a robust mechanism for identifying high-probability trading opportunities.
[E5 Trading] Advanced RSIAdvanced RSI Overview
The traditional RSI momentum indicator measures the magnitude of price changes over a user-specified period to determine overbought and oversold conditions in the price of an asset.
E5 Trading Advanced RSI adds several sophisticated features to enhance the analysis of RSI to detect early signs of trend reversals and continuations.
Advanced capabilities include customizable fast and slow RSI moving averages, RSI Bollinger Bands, relative overbought and oversold signals, and regular and hidden divergences.
These features provide traders with opportunities to identify confluence using other E5 Trading indicator suite signals and increase the probability of entering winning trades.
RSI Moving Averages
RSI moving average crossovers help determine momentum shifts in the overall trend, similar to price moving average crossovers.
Set the moving average type (default: EMA ), fast-moving RSI period (default: 3), and slow-moving RSI period (default: 5).
When the fast-moving RSI crosses above the slow-moving RSI, bullish. When the fast-moving RSI crosses under the slow-moving RSI, bearish.
The Moving Average Fill feature (default: On) colors the area between the fast-moving and slow-moving RSI lines with bullish and bearish momentum shading.
RSI Bollinger Bands
Like Bollinger Bands for price action, RSI Bollinger Bands can be used as moving oversold and overbought thresholds, which adjust with the RSI oscillator based on its volatility.
When RSI breaks out above the upper RSI Bollinger Band, the asset is overbought on a relative basis, given its price history.
When RSI breaks out below the lower RSI Bollinger Band, the asset is oversold on a relative basis.
Evaluating RSI on a relative basis is more reliable than evaluating RSI on an absolute basis with fixed 30/70 thresholds for oversold/overbought, which traditional RSI analysis relies on.
This is because rigid 30/70 thresholds are arbitrary rules-of-thumb that may (or may not) be relevant to current market conditions.
When RSI is riding the upper or lower Bollinger Bands and breaks towards the middle, this reversion to the mean (i.e., basis line) can signal that the trend may be reversing.
Toggle to turn on the basis (i.e., mean) line of the RSI Bollinger Bands.
The basis line can also be used as a support line when RSI values are above it or as a resistance line when RSI values are below it.
Relative Oversold | Overbought
Relative Oversold | Overbought signals (i.e., dots) provide the Advanced RSI trader with the means to identify trend reversal or continuation opportunities that most traders will miss.
Relative Oversold | Overbought signals reflect an adaptive approach that normalizes RSI data relative to the trend using RSI Bollinger Bands.
These signals improve the reliability of RSI oversold and overbought signals compared to traditional methods and eliminate the need to trade within the confines of fixed 30/70 RSI thresholds.
Signals will appear even when the standard RSI line may be far away from the generally accepted oversold and overbought thresholds (i.e., 30 and 70, respectively).
Advanced RSI Divergences
Divergences occur when a technical indicator, like an oscillator, moves in the opposite direction of the price.
They often serve as an early warning of a trend reversal (via regular divergence signals) or trend continuation (via hidden divergence signals).
Regular divergences provide an early warning signal of potential trend reversals (i.e., trend weakening).
Hidden divergences provide an early warning signal of potential trend continuation (i.e., trend strength).
Regular and Hidden divergences flag in real-time when 'Potential' (default) is selected as the Divergences Confirmation State.
This feature is a leading indicator that provides the trader with an early warning of a potential trend change (regular divergences) or trend continuation (hidden divergences).
Potential RSI regular divergence signals are plotted directly on the RSI chart, with bullish and bearish divergences flagging with an ‘R’ below and above the RSI line, respectively.
Potential RSI hidden divergence signals are plotted directly on the RSI chart, with bullish and bearish divergences flagging with an ‘H’ below and above the RSI line, respectively.
Confirmed RSI regular divergence signals are plotted directly on the RSI chart, with bullish and bearish divergences flagging with an ‘R-Bull’ below and 'R-Bear' above the RSI line, respectively.
Confirmed RSI hidden divergence signals are plotted directly on the RSI chart, with bullish and bearish divergences flagging with an ‘H-Bull’ below and 'H-Bear' above the RSI line, respectively.
Always practice risk management: Use proper position sizing and a stop-loss on every trade.

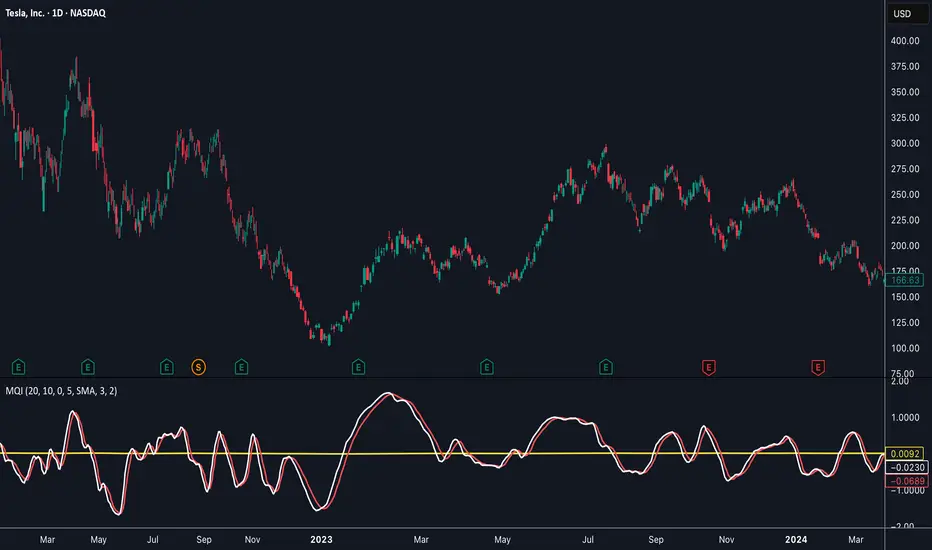
Momentum Quality Index (MQI)
Welcome to the Momentum Quality Index! This indicator aims to provide insight into short term trends by measuring the efficiency of price movement relative to the momentum of the trend. This indicator is designed to work better on short term time frames, capturing the micro-level of trends for practices such as day-trading, options trading, and shorter term swing trading.
How to read:
The main way of reading this indicator is through moving average crossovers. Upwards crossovers indicates uptrends whereas downwards crossovers indicates downtrends.
Customization:
This indicator includes a few adjustable options for fine tuning, such as optimized smoothing options and moving average length for efficiency in spotting reversals.
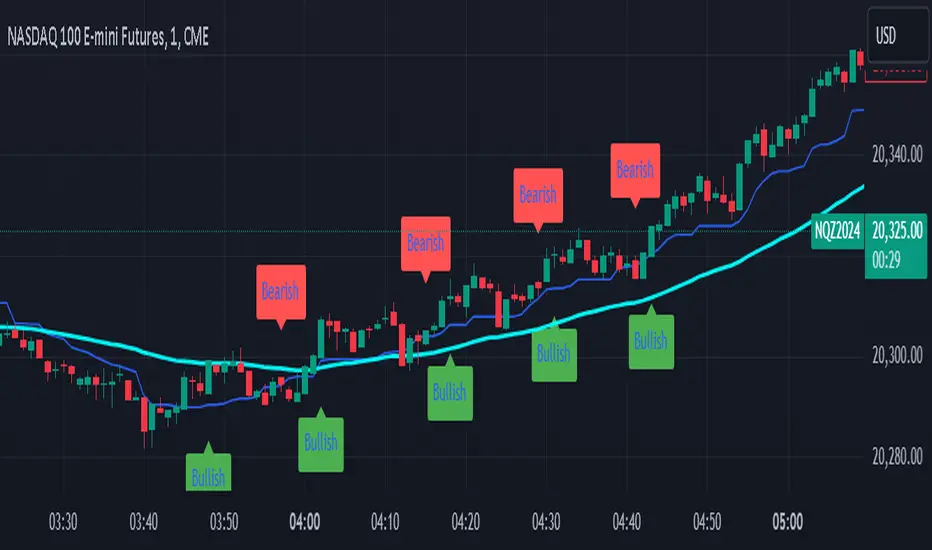
Feigenbaum Inspired Bifurcation IndicatorIts a work in progess but here you go. I pair it with a 50 EMA for better direction.
1. Bullish Trend Signal:
Green Labels ("Bullish") are plotted below the price chart when a bullish trend is detected.
This is based on a crossover of two simple moving averages (short and long):
The short-term moving average (SMA) crosses above the long-term moving average, indicating a potential upward trend or buying opportunity.
2. Bearish Trend Signal:
Red Labels ("Bearish") are plotted above the price chart when a bearish trend is detected.
This occurs when the short-term moving average crosses below the long-term moving average, signaling a potential downward trend or selling opportunity.
3. Mid-Range Line (Optional):
A Blue Line is plotted on the chart, representing the mid-point between the highest high and lowest low over the given period (default is 14 bars).
This line can help visualize where the price is relative to its recent range.
Summary:
Bullish Labels (Green): Appear when a bullish crossover happens.
Bearish Labels (Red): Appear when a bearish crossover happens.
Mid-Range Line (Blue): Helps identify the midpoint of recent price ranges (can be turned off if not needed).
This is a simplified trend-following indicator based on moving average crossovers, giving you a quick visual cue of when trends are shifting. Let me know if you’d like further adjustments!
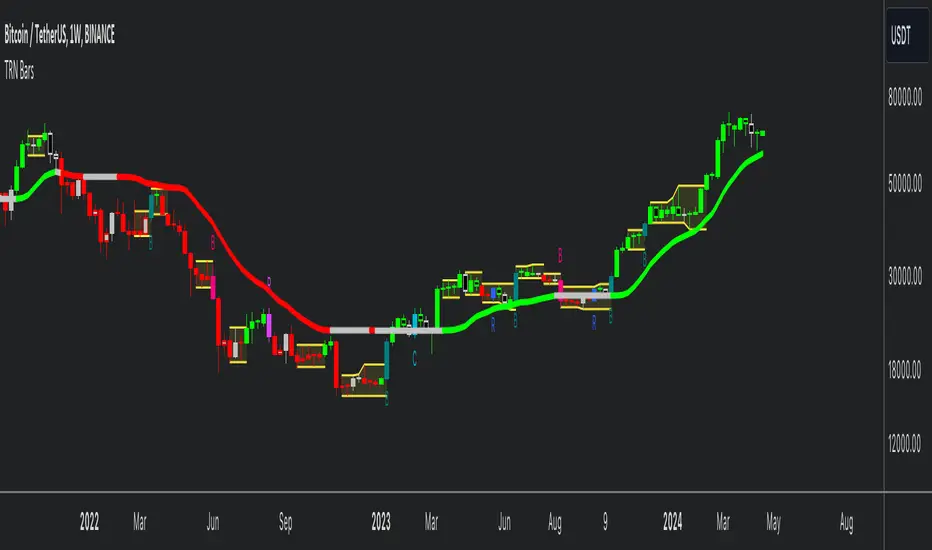
Trend Bars Pro (HTF PO3)Hello Traders!
The innovative TRN Trend Bars Pro are designed to help traders to analyze markets in an intuitive way and provide high probability entry and exit signals. It combines three core concepts:
TRN Trend Bars to see the current trend and reversals (replaces the default chart bars)
Bar Ranges to highlight consolidations
Dynamic Trend to see the overall trend.
First, let's have a look at each of these concepts individually. Afterwards, we describe how a combination of all three gives you a crystal-clear picture of the market.
TRN Trend Bars Pro
They show bullish and bearish trends and reversals based on color coding the bars and give high probability trade opportunities with special colors. The trend analysis is based on a new algorithm that includes several different inputs:
classical and advanced bar patterns and their statistical frequency
probability distributions of price expansions after certain bar patterns
bar information such as wick length in %, overlapping of the previous bar in % and many more
historical trend and consolidation analysis
The algorithm weighs these concepts and outputs a color scheme for the chart bars or candlesticks.
Bar Types
Trend bars in green and red
Reversal Bars in blue and fuchsia
Continuation Bars in turquoise and orange
Breakout Bars in dark green and pink
Green Bars signify a sustained uptrend, indicating bullish market sentiment. On the other hand, Red Bars indicate a persistent downtrend, representing bearish market sentiment. The transition from red to green denotes a bullish trend reversal, suggesting a shift from bearish to bullish sentiment. Conversely, the shift from green to red signals a bearish trend reversal, indicating a transition from bullish to bearish sentiment. By monitoring these color changes, traders can identify potential trend reversals and make informed trading decisions.
The presence of gray and black bars indicates a neutral market state, often observed before an impending color change from red to green or green to red. These neutral bars serve as a transition phase between the previous trend and the potential reversal.
The TRN Trend Bars Pro incorporate signal bars, distinguished by their distinct colors, to offer potential buy and sell signals and deeper insights into market dynamics.
Reversal Bars
The presence of blue Reversal Bars indicates a trend reversal to the upside, while pink Reversal Bars indicate a reversal to the downside. These bars not only serve as signals for potential trend shifts but also present favorable opportunities to enter the market or increase one's position size.
Continuation Bars
In addition to the reversal bars, the indicator also includes bullish continuation bars (colored turquoise) and bearish continuation bars (colored orange). These bars act as signals for the continuation of an existing trend. Like the reversal bars, they can be utilized as entry points or opportunities to augment one's position size.
Breakout Bars
The dark green breakout bars within TRN Trend Bars Pro show a powerful breakout from a price range detected by our integrated bar range feature. They signify the continuation or potential change in a trend following a consolidation phase. As such, these bars hold dual functionality, serving as reversal signals and validating the persistence of an ongoing trend.
Bar Ranges
The bar range feature automatically finds consolidations where the price range of several consecutives bars is rather small. The detection of the bar ranges includes among other things the overlapping percentage of these bars.
How to Use Price Ranges
Here are a few ways you can use the bar ranges in your trading:
Identify Support and Resistance Levels
The price ranges can help you identify key support and resistance levels on a chart. By observing price ranges and identifying these levels, you can make more informed decisions about entering or exiting trades.
Breakout Trading
Price ranges can also provide insights into potential breakout opportunities. Breakouts occur when the price breaks out of a defined range, signaling a potential shift in market sentiment and the start of a new trend. The Color highlighted Breakout Bars from the TRN Trend Bars Pro are signaling a powerful breakout of a price range. Traders can enter positions in the direction of the breakout and set appropriate stop-loss orders to manage risk. Note that not every price range is left by a powerful breakout.
Dynamic Trend
The Dynamic Trend combines elements from standard trend strength indicators (e.g. DI-, DI+, Parabolic SAR) and volatility indicators (e.g. ATR, Standard Deviation). It produces a moving average line that adapts to changing market volatility. It is inspired by the ideas of the programmer and trader Fat Tails. The adaptive behavior provides more relevant information for traders when compared to traditional moving averages which do not consider volatility and trend strength together. This makes the Dynamic Trend completely unique, and no other moving average indicator can give you this precision.
How to use Dynamic Trend
Generally, a rising Dynamic Trend line, displayed in green, indicates that an uptrend is strong, while a falling Dynamic Trend, displayed in red, suggests that the downtrend is sharp. The Dynamic Trend turns gray when there is insufficient clarity to establish a distinct trend and especially when there is not volatility in the market.
Identify potential trade entries and exits: When used in conjunction with price action, the Dynamic Trend can provide potential trade signals. For example, if the price crosses above the Dynamic Trend, it may be a bullish sign, suggesting a potential buy entry. Conversely, if the price crosses below the Dynamic Trend, it may indicate bearish conditions and a potential sell signal.
Trend Identification and Pullback trading
Observe the Dynamic Trend's color. When it's on the rise and appears green, it indicates a bullish trend. Conversely, if it's in decline and displayed in red, it signals a bearish trend.
If Dynamic Trend is green and price pulls from above back to the Dynamic Trend, then this can be considered as a bullish signal.
If Dynamic Trend is red and price pulls from below back to the Dynamic Trend, then this can be considered as a bearish signal.
In the event of a bearish signal, such as a bearish TRN Signal Bar, and the Dynamic Trend is red, it provides additional confirmation to the bearish signal. Likewise, bullish signals gain added conviction when the Dynamic Trend is green.
Crossovers
As with other moving averages, crossovers between the Dynamic Trend and the price can be significant.
If price is crossing above the Dynamic Trend, then this can be considered as a bullish signal.
If price is crossing below the Dynamic Trend, then this can be considered as a bearish signal.
If you currently hold a position, both bullish and bearish crossovers can serve as potential exit signals. For instance, in the case of a long position, a bearish crossover can indicate a potential shift in sentiment, signaling a bearish reversal and a potential opportunity to close your long position.
Filtering Noise
Due to its adaptive nature, the Dynamic Trend can be a useful tool to filter out market noise. When the market is choppy or consolidating, the Dynamic Trend tends to remain flat and colored gray, signaling traders to potentially stay out of the market.
Stop Losses
The Dynamic Trend can also be used as a dynamic stop loss. For instance, in a long trade, traders can use the Dynamic Trend as a trailing stop, selling their position if the price crosses below the Dynamic Trend.
Combining TRN Trend Bars Pro, Bar Ranges and Dynamic Trend together
Combining all three concepts gives you a crystal-clear picture of the market. The Dynamic Trend shows you the overall trend. If price pulls back to the dynamic trend line and then price picks up the trend direction again, then the TRN Trend Bars Pro immediately switches the color to the trend direction. Therefore, you can easily identify high probability entry signals based on the bar color.
As a simple trading model, you can set the stop loss below the last swing or below a TRN signal bar (vice versa for short entries) and use 2.5 R or 3 R as target.
You can increase the success rate of the high probability TRN signal bars entries even more if they are in line with the Dynamic Trend line.
On the other hand, the TRN Bar Ranges help you to stay out of the market in case the price does not really change. As a confluence signal to stay flat in this period the dynamic trend line tends to be grey as well. If the price breaks out of the range, then the indicator prints a breakout bar which serves as a high probability entry signal.
Although it is possible to switch off any of these concepts, it is highly recommended to use all three in combination to get a crystal-clear picture of the market.
Alerts
Experience the power of our TRN Trend Bars Pro alerts, delivering real-time notifications for trend changes, price range breakouts, and signal bar formations or confirmations. Stay on top of the market with these versatile alerts, customizable to your preferred assets and timeframes.
Conclusion
While signals from TRN Trend Bars Pro can be informative, it is important to recognize that their reliability may vary. Various external factors can impact market prices, and it is essential to consider your risk tolerance and investment goals when executing trades.
Risk Disclaimer
The content, tools, scripts, articles, and educational resources offered by TRN Trading are intended solely for informational and educational purposes. Remember, past performance does not ensure future outcomes.

TRN BarsThe innovative TRN Bars are designed to help traders to analyze markets in an intuitive way. It combines three core concepts:
TRN Bars to see the current trend and reversals (replaces the default chart bars)
Bar Ranges to highlight consolidations
Dynamic Trend to see the overall trend.
First, let's have a look at each of these concepts individually. Afterwards, we describe how a combination of all three gives you a crystal-clear picture of the market.
TRN Bars
They show bullish and bearish trends and reversals based on color coding the bars and give high probability trade opportunities with special colors. The trend analysis is based on a new algorithm that includes several different inputs:
classical and advanced bar patterns and their statistical frequency
probability distributions of price expansions after certain bar patterns
bar information such as wick length in %, overlapping of the previous bar in % and many more
historical trend and consolidation analysis
The algorithm weighs these concepts and outputs a color scheme for the chart bars or candlesticks.
Bar Types
Trend bars in green and red
Reversal Bars in blue and fuchsia
Continuation Bars in turquoise and orange
Breakout Bars in dark green and pink
Green Bars signify a sustained uptrend, indicating bullish market sentiment. On the other hand, Red Bars indicate a persistent downtrend, representing bearish market sentiment. The transition from red to green denotes a bullish trend reversal, suggesting a shift from bearish to bullish sentiment. Conversely, the shift from green to red signals a bearish trend reversal, indicating a transition from bullish to bearish sentiment. By monitoring these color changes, traders can identify potential trend reversals and make informed trading decisions.
The presence of gray and black bars indicates a neutral market state, often observed before an impending color change from red to green or green to red. These neutral bars serve as a transition phase between the previous trend and the potential reversal.
The TRN Bars incorporate Signal Bars, distinguished by their distinct colors, to offer potential buy and sell signals and deeper insights into market dynamics.
Reversal Bars
The presence of blue Reversal Bars indicates a trend reversal to the upside, while pink Reversal Bars indicate a reversal to the downside. These bars not only serve as signals for potential trend shifts but also present favorable opportunities to enter the market or increase one's position size.
Continuation Bars
In addition to the reversal bars, TRN Bars also include bullish continuation bars (colored turquoise) and bearish continuation bars (colored orange). These bars act as signals for the continuation of an existing trend. Like the reversal bars, they can be utilized as entry points or opportunities to augment one's position size.
Breakout Bars
The dark green breakout bars within TRN Bars show a powerful breakout from a price range detected by our integrated bar range feature. They signify the continuation or potential change in a trend following a consolidation phase. As such, these bars hold dual functionality, serving as reversal signals and validating the persistence of an ongoing trend.
Bar Ranges
The bar range feature automatically finds consolidations where the price range of several consecutives bars is rather small. The detection of the bar ranges includes among other things the overlapping percentage of these bars.
How to Use Price Ranges
Here are a few ways you can use the bar ranges in your trading:
Identify Support and Resistance Levels
The price ranges can help you identify key support and resistance levels on a chart. By observing price ranges and identifying these levels, you can make more informed decisions about entering or exiting trades.
Breakout Trading
Price ranges can also provide insights into potential breakout opportunities. Breakouts occur when the price breaks out of a defined range, signaling a potential shift in market sentiment and the start of a new trend. The Color highlighted Breakout Bars from the TRN Bars are signaling a powerful breakout of a price range. Traders can enter positions in the direction of the breakout and set appropriate stop-loss orders to manage risk. Note that not every price range is left by a powerful breakout.
Dynamic Trend
The Dynamic Trend combines elements from standard trend strength indicators (e.g. DI-, DI+, Parabolic SAR) and volatility indicators (e.g. ATR, Standard Deviation). It produces a moving average line that adapts to changing market volatility. It is inspired by the ideas of the programmer and trader Fat Tails. The adaptive behavior provides more relevant information for traders when compared to traditional moving averages which do not consider volatility and trend strength together. This makes the Dynamic Trend completely unique, and no other moving average indicator can give you this precision.
How to use Dynamic Trend
Generally, a rising Dynamic Trend line, displayed in green, indicates that an uptrend is strong, while a falling Dynamic Trend, displayed in red, suggests that the downtrend is sharp. The Dynamic Trend turns gray when there is insufficient clarity to establish a distinct trend and especially when there is not volatility in the market.
Identify potential trade entries and exits: When used in conjunction with price action, the Dynamic Trend can provide potential trade signals. For example, if the price crosses above the Dynamic Trend, it may be a bullish sign, suggesting a potential buy entry. Conversely, if the price crosses below the Dynamic Trend, it may indicate bearish conditions and a potential sell signal.
Trend Identification and Pullback trading
Observe the Dynamic Trend's color. When it's on the rise and appears green, it indicates a bullish trend. Conversely, if it's in decline and displayed in red, it signals a bearish trend.
If Dynamic Trend is green and price pulls from above back to the Dynamic Trend, then this can be considered as a bullish signal.
If Dynamic Trend is red and price pulls from below back to the Dynamic Trend, then this can be considered as a bearish signal.
In the event of a bearish signal, such as a bearish TRN Signal Bar, and the Dynamic Trend is red, it provides additional confirmation to the bearish signal. Likewise, bullish signals gain added conviction when the Dynamic Trend is green.
Crossovers
As with other moving averages, crossovers between the Dynamic Trend and the price can be significant.
If price is crossing above the Dynamic Trend, then this can be considered as a bullish signal.
If price is crossing below the Dynamic Trend, then this can be considered as a bearish signal.
If you currently hold a position, both bullish and bearish crossovers can serve as potential exit signals. For instance, in the case of a long position, a bearish crossover can indicate a potential shift in sentiment, signaling a bearish reversal and a potential opportunity to close your long position.
Filtering Noise
Due to its adaptive nature, the Dynamic Trend can be a useful tool to filter out market noise. When the market is choppy or consolidating, the Dynamic Trend tends to remain flat and colored gray, signaling traders to potentially stay out of the market.
Stop Losses
The Dynamic Trend can also be used as a dynamic stop loss. For instance, in a long trade, traders can use the Dynamic Trend as a trailing stop, selling their position if the price crosses below the Dynamic Trend.
Combining TRN Bars, Bar Ranges and Dynamic Trend together
Combining all three concepts gives you a crystal-clear picture of the market. The Dynamic Trend shows you the overall trend. If price pulls back to the dynamic trend line and then price picks up the trend direction again, then the TRN Bars immediately switch the color to the trend direction. Therefore, you can easily identify high probability entry signals based on the bar color.
As a simple trading model, you can set the stop loss below the last swing or below a TRN signal bar (vice versa for short entries) and use 2.5 R or 3 R as target.
You can increase the success rate of the high probability TRN signal bars entries even more if they are in line with the Dynamic Trend line.
On the other hand, the TRN Bar Ranges help you to stay out of the market in case the price does not really change. As a confluence signal to stay flat in this period the dynamic trend line tends to be grey as well. If the price breaks out of the range, then the TRN Bars print a breakout bar which serves as a high probability entry signal.
Although it is possible to switch off any of these concepts, it is highly recommended to use all three in combination to get a crystal-clear picture of the market.
Alerts
Experience the power of our TRN Bars Alerts, delivering real-time notifications for trend changes, price range breakouts, and signal bar formations or confirmations. Stay on top of the market with these versatile alerts, customizable to your preferred assets and timeframes.
Conclusion
While signals from TRN Bars can be informative, it is important to recognize that their reliability may vary. Various external factors can impact market prices, and it is essential to consider your risk tolerance and investment goals when executing trades.
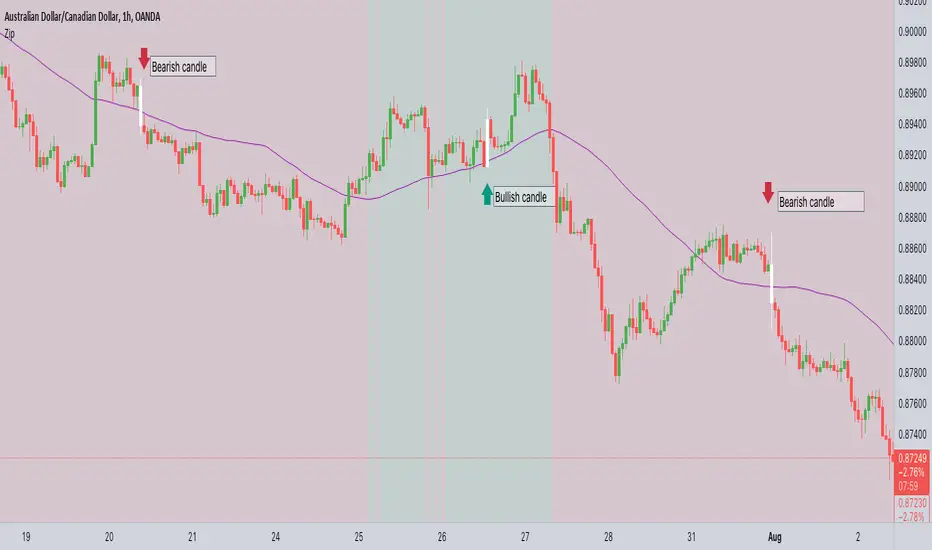
ZIP Entry Strategy( Using 50 SMA and 100 SMA)Description:
This strategy uses only two simple moving averages, specifically the 50 SMA and the 100 SMA.
Simple moving average : A simple moving average (SMA) calculates the average of a selected range of prices, usually closing prices, by the number of periods in that range.
Here's how it works:
Background color:
The chart background is colored green when the price is above the 100 SMA.
The chart background turns red when the price is below the 100 SMA.
The greenback ground suggest the bullish momentum and the red background suggests the bearish momentum.
We can use this long term trend to take the trades in alignment with the trend to increase our odds.
We will use the 50 SMA to identify the spots when a new trend is starting. When the price crosses above the 50 SMA while the background is green, the candle/bar color changes to white indicating a new trend beginning.
Conversely, when the price crosses below the 50 SMA while the background is red, the candle/bar color also changes to white indicating a new trend beginning.
The occurrence of white candles indicates the start of a potential new trend in alignment with the long term trend.
However, it's essential to remember that like any trading strategy, this one is not perfect. For more reliable results, it's advisable to combine it with a consideration of the overall price structure to minimize false entry signals.
Originality and usefulness
Even though it makes use of two moving averages, we don't use the moving average crossover. The moving average crossovers are either lagging or provide too many false signals. We have tried to address these issue with this strategy. While maintaining the long-term trend and ignoring false signals, it gives out signals early.
You can choose the moving average that best suits your needs by changing these moving averages to a different moving average . The 50 SMA and 100 SMA appeared to be giving the better signals in my experience.
I dont use any other indicators but i would like to check the price structure to make sure its moving along with the 50 SMA. Sometimes the choppy markets might give false signals.
Its okay to see multiple white candles as long as the price structure holds.
I have highlighted the white candles in the above chart. The color of the candle is always the same so the background decides whether its bearish or bullish cross
Classic Long Term Trend Following SystemThis is a classic long term trend following system.
The breakout period is 50 days instead of 20 and the moving average crossover are 40 and 120.
The moving averages are also exponential instead of simple.
The stoploss is 4 ATRs away from the price.
Recommendations:
Donchian Channels settings > 50 days
Moving Averages > 40 and 120, 80 and 140
Important to note:
My first strategy, DC Breakout System | This is simplicity at its finest, is best used on the crypto market and this one for stocks, commodities, currencies, etc. Those markets tend to trend a lot longer than crypto do.

SIMPLE MOVING AVG 10,20,50,100,200 with RESOLUTIONThis indicator is the best than all other sma indicators.Because in just one click you can change all the resolution /time frames for all the sma .
Multitime frame analysis can be done in just one click. just change the resolution to
15 min/30 min/1hr- if you intraday trader
1D- LONG TERM INVESTORS.
Multi-timeframe analysis (MTF) is a process in which traders can view the same ticker/indicator using a higher time frame than the chart’s, for example, displaying a daily moving average on a one-hour chart in just two clicks.
How to Use this to Buy Stocks ?
The technical indicator known as the Death cross occurs when the 50-day SMA crosses below the 200-day SMA => Bearish Signal.
An opposite indicator, known as the Golden cross, occurs when the 50-day SMA crosses above the 200-day SMA => Bullish Signal.
Crossovers are one of the main moving average strategies.
1st Strategy is the first type is a price crossover, which is when the price crosses above the sma => Buy signal
when the price crosses below the sma => Sell signal
2nd Strategy is to apply two moving averages to a chart: one longer and one shorter.
When the shorter-term MA (100) crosses above the longer-term MA (200), it's a buy signal, indicates trend is shifting up.
This is known as a "Golden cross."
Meanwhile, when the shorter-term MA (100) crosses below the longer-term MA (200), it's a sell signal, indicates trend is shifting down.
This is known as a "Dead/death cross."
The time frame or length you choose for a moving average, also called the "look back period," can play a big role in how effective it is.
An MA with a short time frame will react much quicker to price changes than an MA with a long look back period. In the figure below, the 20-day moving average more closely tracks the actual price than the 100-day moving average does.
A 20-day MA = more beneficial to a shorter-term trader, since it follows the price more closely.
A 100-day MA = more beneficial to a longer-term trader.
Moving averages work quite well in strong trending conditions but poorly in choppy or ranging conditions.
use this indicator along with Price action theory and not alone.
Moving average crossovers are a popular strategy for both entries and exits. MAs can also highlight areas of potential support or resistance
Happy Trading

Dami's HMA Strategy"Dami's HMA Strategy: Dynamic Crossover with Momentum Filter"
Key Points to Include:
Foundation: The strategy is based on the Hull Moving Average (HMA), noted for its speed and reduced lag, making it ideal for identifying trend inflection points early.
Enhanced Logic: Unlike a simple moving average crossover, this strategy incorporates a momentum filter. A signal is only triggered if the HMA crossover coincides with a candle moving in the direction of the new trend (bullish candle for Long, bearish candle for Short). This aims to confirm the impulse and avoid false entries during consolidation periods or 'weak' crossovers.
100% Market Coverage System: It is a continuous reversal system. Every new signal (Long or Short) closes the opposite position, ensuring the trader is always positioned in the direction indicated by the HMA.
Complementary Visualization: It includes the 8-Period High/Low Bands (Dami's Bands) to provide visual context of the recent price range, although they do not affect trading orders.
Adjustment and Optimization: The HMA length (hma_len=9 by default) is the key parameter to optimize based on the specific pair and timeframe. Higher values will generate fewer signals and be slower, while lower values (like the current 9) make it more sensitive.

Hash Momentum Strategy# Hash Momentum Strategy
## 📊 Overview
The **Hash Momentum Strategy** is a professional-grade momentum trading system designed to capture strong directional price movements with precision timing and intelligent risk management. Unlike traditional EMA crossover strategies, this system uses momentum acceleration as its primary signal, resulting in earlier entries and better risk-to-reward ratios.
---
## ⚡ What Makes This Strategy Unique
### 1. Momentum-Based Entry System
Most strategies rely on lagging indicators like moving average crossovers. This strategy captures momentum *acceleration* - entering when price movement is gaining strength, not after the move has already happened.
### 2. Programmable Risk-to-Reward
Set your exact R:R ratio (1:2, 1:2.5, 1:3, etc.) and the strategy automatically calculates stop loss and take profit levels. No more guessing or manual calculations.
### 3. Smart Partial Profit Taking
Lock in profits at multiple stages:
- **First TP**: Take 50% off at 2R
- **Second TP**: Take 40% off at 2.5R
- **Final TP**: Let 10% ride to maximum target
This approach locks in gains while letting winners run.
### 4. Dynamic Momentum Threshold
Uses ATR (Average True Range) multiplied by your threshold setting to adapt to market volatility. Volatile markets = higher threshold. Quiet markets = lower threshold.
### 5. Trade Cooldown System
Prevents overtrading and revenge trading by enforcing a cooldown period between trades. Configurable from 1-24 bars.
### 6. Optional Session & Weekend Filters
Filter trades by Tokyo, London, and New York sessions. Optional weekend-off toggle to avoid low-liquidity periods.
---
## 🎯 How It Works
### Signal Generation
**STEP 1: Calculate Momentum**
- Momentum = Current Price - Price
- Check if Momentum > ATR × Threshold Multiplier
- Momentum must be accelerating (positive change in momentum)
**STEP 2: Confirm with EMA Trend Filter**
- Long: Price must be above EMA
- Short: Price must be below EMA
**STEP 3: Check Filters**
- Not in cooldown period
- Valid session (if enabled)
- Not weekend (if enabled)
**STEP 4: ENTRY SIGNAL TRIGGERED**
### Risk Management Example
**Example Long Trade:**
- Entry: $100
- Stop Loss: $97.80 (2.2% risk)
- Risk Amount: $2.20
**Take Profit Levels:**
- TP1: $104.40 (2R = $4.40) → Close 50%
- TP2: $105.50 (2.5R = $5.50) → Close 40%
- Final: $105.50 (2.5R) → Close remaining 10%
---
## ⚙️ Settings Guide
### Core Strategy
**Momentum Length** (Default: 13)
Number of bars for momentum calculation. Higher = stronger but fewer signals.
**Momentum Threshold** (Default: 2.25)
ATR multiplier. Higher = only trade biggest moves.
**Use EMA Trend Filter** (Default: ON)
Only long above EMA, short below EMA.
**EMA Length** (Default: 28)
Period for trend-confirming EMA.
### Filters
**Use Trading Session Filter** (Default: OFF)
Restrict trading to specific sessions.
**Tokyo Session** (Default: OFF)
Trade during Asian hours (00:00-09:00 JST).
**London Session** (Default: OFF)
Trade during European hours (08:00-17:00 GMT).
**New York Session** (Default: OFF)
Trade during US hours (08:00-17:00 EST).
**Weekend Off** (Default: OFF)
Disable trading on Saturdays and Sundays.
### Risk Management
**Stop Loss %** (Default: 2.2)
Fixed percentage stop loss from entry.
**Risk:Reward Ratio** (Default: 2.5)
Your target reward as multiple of risk.
**Use Partial Profit Taking** (Default: ON)
Take profits in stages.
**First TP R:R** (Default: 2.0)
First target as multiple of risk.
**First TP Size %** (Default: 50)
Percentage of position to close at TP1.
**Second TP R:R** (Default: 2.5)
Second target as multiple of risk.
**Second TP Size %** (Default: 40)
Percentage of position to close at TP2.
### Trade Management
**Use Trade Cooldown** (Default: ON)
Prevent overtrading.
**Cooldown Bars** (Default: 6)
Bars to wait after closing a trade.
---
## 🎨 Visual Elements
### Chart Indicators
🟢 **Green Dot** (below bar) = Long entry signal
🔴 **Red Dot** (above bar) = Short entry signal
🔵 **Blue X** (above bar) = Long position closed
🟠 **Orange X** (below bar) = Short position closed
**EMA Line** = Trend direction (green when bullish, red when bearish)
**White Line** = Entry price
**Red Line** = Stop loss level
**Green Lines** = Take profit levels (TP1, TP2, Final)
### Dashboard
When not in real-time mode, a dashboard displays:
- Current position (LONG/SHORT/FLAT)
- Entry price
- Stop loss price
- Take profit price
- R:R ratio
- Current momentum strength
- Total trades
- Win rate
- Net profit %
---
## 📈 Recommended Settings by Timeframe
### 1-Hour Timeframe (Default)
- Momentum Length: 13
- Momentum Threshold: 2.25
- EMA Length: 28
- Stop Loss: 2.2%
- R:R Ratio: 2.5
- Cooldown: 6 bars
### 4-Hour Timeframe
- Momentum Length: 24-36
- Momentum Threshold: 2.5
- EMA Length: 50
- Stop Loss: 3-4%
- R:R Ratio: 2.0-2.5
- Cooldown: 6-8 bars
### 15-Minute Timeframe
- Momentum Length: 8-10
- Momentum Threshold: 2.0
- EMA Length: 20
- Stop Loss: 1.5-2%
- R:R Ratio: 2.0
- Cooldown: 4-6 bars
---
## 🔧 Optimization Tips
### Want More Trades?
- Decrease Momentum Threshold (2.0 instead of 2.25)
- Decrease Momentum Length (10 instead of 13)
- Decrease Cooldown Bars (4 instead of 6)
### Want Higher Quality Trades?
- Increase Momentum Threshold (2.5-3.0)
- Increase Momentum Length (18-24)
- Increase Cooldown Bars (8-10)
### Want Lower Drawdown?
- Increase Cooldown Bars
- Use tighter stop loss
- Enable session filters (trade only high-liquidity sessions)
- Enable Weekend Off
### Want Higher Win Rate?
- Increase R:R Ratio (may reduce total profit)
- Increase Momentum Threshold (fewer but stronger signals)
- Use longer EMA for trend confirmation
---
## 📊 Performance Expectations
Based on typical backtesting results:
- **Win Rate**: 35-45%
- **Profit Factor**: 1.5-2.0
- **Risk:Reward**: 1:2.5 (configurable)
- **Max Drawdown**: 10-20%
- **Trades/Month**: 8-15 (1H timeframe)
**Note:** Win rate may appear low, but with 2.5:1 R:R, you only need ~29% win rate to break even. The strategy aims for quality over quantity.
---
## 🎓 Strategy Logic Explained
### Why Momentum > EMA Crossover?
**EMA Crossover Problems:**
- Signals lag behind price
- Late entries = poor R:R
- Many false signals in ranging markets
**Momentum Advantages:**
- Catches moves as they start accelerating
- Earlier entries = better R:R
- Adapts to volatility via ATR
### Why Partial Profit Taking?
**Without Partial TPs:**
- All-or-nothing approach
- Winners often turn to losers
- High stress watching open positions
**With Partial TPs:**
- Lock in 50% at first target
- Reduce risk to breakeven
- Let remainder ride for bigger gains
- Lower psychological pressure
### Why Trade Cooldown?
**Without Cooldown:**
- Revenge trading after losses
- Overtrading in choppy markets
- Emotional decision-making
**With Cooldown:**
- Forces discipline
- Waits for new setup to develop
- Reduces transaction costs
- Better signal quality
---
## ⚠️ Important Notes
1. **This is a momentum strategy, not an EMA strategy**
The EMA only confirms trend direction. Momentum generates the actual signals.
2. **Backtest thoroughly before live trading**
Past performance ≠ future results. Test on your specific asset and timeframe.
3. **Use proper position sizing**
Risk 1-2% of account per trade maximum. The strategy uses 100% equity by default (adjust in Properties).
4. **Dashboard auto-hides in real-time**
Clean chart for live trading. Visible during backtesting.
5. **Customize for your trading style**
All settings are fully adjustable. No single "best" configuration.
---
## 🚀 Quick Start Guide
1. **Add to Chart**: Apply to your preferred asset and timeframe
2. **Keep Defaults**: Start with default settings
3. **Backtest**: Review historical performance
4. **Paper Trade**: Test with simulated money first
5. **Go Live**: Start small and scale up
---
## 💡 Pro Tips
**Tip 1: Combine Timeframes**
Use higher timeframe (4H) for trend direction, lower timeframe (1H) for entries.
**Tip 2: Avoid News Events**
Major news can cause whipsaws. Consider manual intervention during high-impact events.
**Tip 3: Monitor Momentum Strength**
Dashboard shows momentum in sigma (σ). Values >1.0σ indicate very strong momentum.
**Tip 4: Adjust for Volatility**
In high-volatility markets, increase threshold and stop loss. In quiet markets, decrease them.
**Tip 5: Review Losing Trades**
Check if losses are hitting stop loss or reversing. Adjust stop accordingly.
---
## 📝 Changelog
**v1.0** - Initial Release
- Momentum-based signal generation
- EMA trend filter
- Programmable R:R ratio
- Partial profit taking (3 stages)
- Trade cooldown system
- Session filters (Tokyo/London/New York)
- Weekend off toggle
- Smart dashboard (auto-hides in real-time)
- Clean visual design
---
## 🙏 Credits
Developed by **Hash Capital Research**
If you find this strategy useful, please give it a like and share with others!
---
## ⚖️ Disclaimer
This strategy is for educational purposes only. Trading involves substantial risk of loss and is not suitable for all investors. Past performance is not indicative of future results. Always do your own research and consult with a qualified financial advisor before trading.
---
## 📬 Feedback
Have suggestions or found a bug? Leave a comment below! I'm continuously improving this strategy based on community feedback.
---
**Happy Trading! 🚀📈**

Price Movement Predictor (PMP)The Price Movement Predictor (PMP) is a versatile trading indicator designed to assist traders in identifying potential buy and sell opportunities in the market. This indicator utilizes a combination of technical analysis tools to generate signals based on the relative strength index (RSI) and moving averages, ensuring a robust and strategic approach to trading.
Key Features:
RSI-Based Signal Generation:
The indicator monitors the RSI to identify overbought and oversold conditions in the market.
A buy signal is generated when the RSI drops below a predefined oversold threshold, indicating potential upward price movement.
Conversely, a sell signal is triggered when the RSI exceeds a specified overbought level, suggesting a possible price decline.
Moving Average Confirmation:
The indicator employs two moving averages: a short-term and a long-term moving average.
Buy and sell signals are confirmed only after a crossover event occurs, ensuring that trades are entered in alignment with market trends.
The short moving average crossing above the long moving average confirms a buy signal, while a crossover below confirms a sell signal.
Take Profit and Stop Loss Management:
The PMP includes adjustable take profit and stop loss levels, which are automatically calculated based on user-defined percentages.
Labels indicating the take profit (TP) and stop loss (SL) levels are plotted on the chart, helping traders manage their risk effectively.
Alerts are available for both TP and SL conditions, allowing traders to stay informed about their trade outcomes.
User-Friendly Interface:
The indicator provides an intuitive setup with adjustable parameters for moving average lengths, RSI levels, and TP/SL ratios.
Clear buy and sell signals are displayed directly on the chart, making it easy for traders to act on potential opportunities.
Usage:
The Price Movement Predictor is ideal for traders who seek a systematic approach to identify trading opportunities and manage risk. By combining RSI signals with moving average crossovers, the indicator helps filter out false signals and enhances the accuracy of trade entries. It is suitable for various trading styles, including day trading, swing trading, and long-term investing.

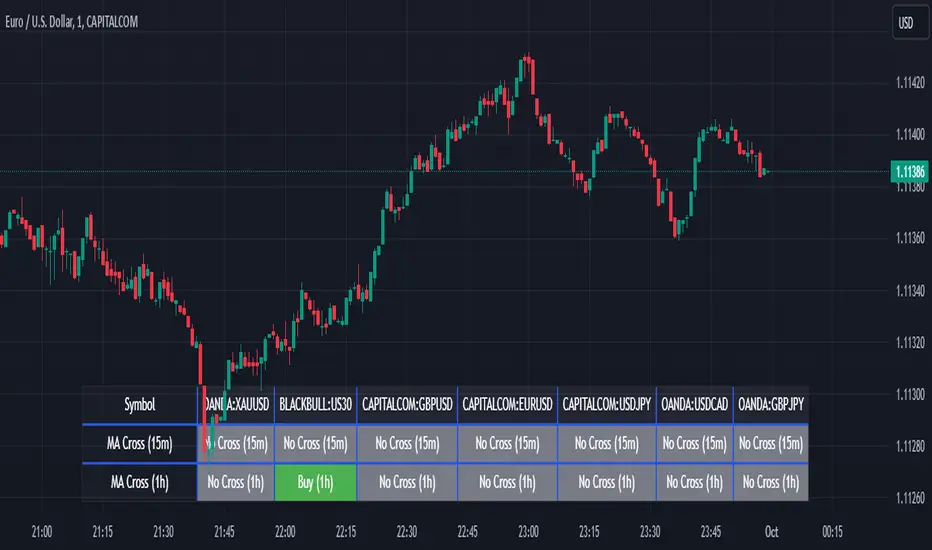
Screener MA CrossThe Screener MA Cross is an efficient tool designed to help traders quickly identify potential buy and sell signals across multiple currency pairs and timeframes. This script monitors the crossover behavior of two moving averages (MA8 and MA50) to determine possible entry points for trades.
Key Features:
Multi-Pair Monitoring: The indicator allows users to screen popular assets, including XAUUSD, US30, GBPUSD, EURUSD, USDJPY, USDCAD, and GBPJPY. You can add or remove symbols based on your preference.
Dual Timeframe Analysis: It tracks moving average crossovers on both 15-minute and 1-hour charts, giving users insights into short-term and medium-term trends without switching between timeframes.
Color-Coded Signals:
Green: Indicates a bullish "Buy" signal when the MA8 crosses above the MA50, suggesting upward momentum.
Red: Indicates a bearish "Sell" signal when the MA8 crosses below the MA50, signaling downward momentum.
Gray: Represents a neutral or no-cross state, indicating no clear trend.
Clean Table Format: Displays all relevant signals directly on your chart in a structured, easy-to-read table format, allowing you to quickly scan and assess trading opportunities.
How It Works: The script uses moving averages (MA8 and MA50) to analyze crossover patterns, a common method for identifying trend changes. A crossover occurs when a shorter moving average (MA8) crosses above or below a longer moving average (MA50). By requesting data from the 15-minute and 1-hour timeframes, the Screener MA Cross provides a clear overview of the market situation across various assets, helping you decide on potential trades.
This tool is particularly useful for trend-following strategies and can be used to spot momentum shifts on smaller timeframes, making it ideal for day traders and scalpers.
How to Use:
Add the indicator to your chart and customize the asset symbols to match your trading preferences.
Monitor the signals on the table. Green signals indicate potential buying opportunities, while red signals suggest possible selling points.
Use alongside other analysis: While the Screener MA Cross offers valuable insights, it's best used in combination with other indicators and analysis techniques to confirm trade setups.
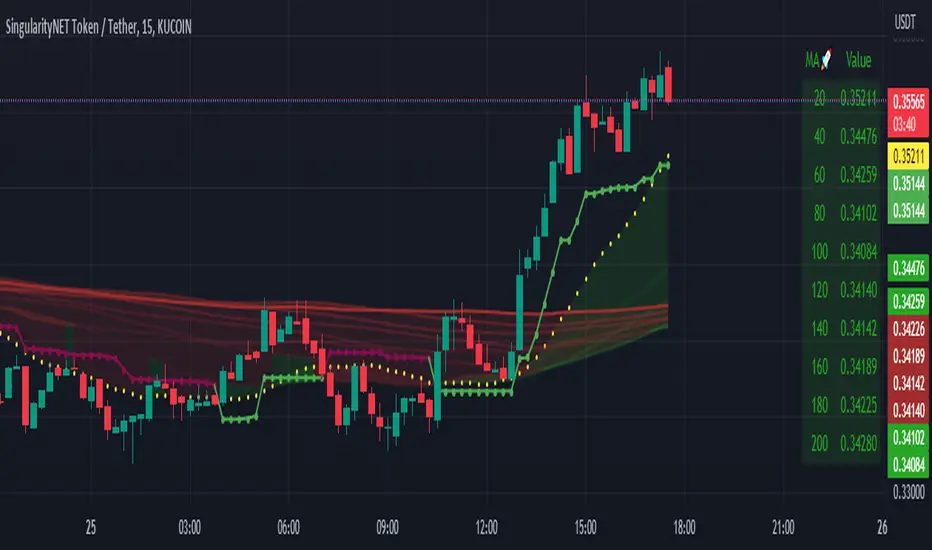
Moving Average Scalper by nnamdertWhat does this Indicator Do?
By request and popular demand, I have created a quick and easy Moving Average Crossover Scalper Indicator. This indicator simply allows the trader to visualize scalping opportunities in an easy way using MA crossovers.
The Indicator also plots multiple higher moving averages via an "optional" table. The table gives a quick glance at the overall trend (based on moving Averages alone).
Users can adjust the initial Moving Average Length and the number of additional Moving Average Lengths to be plotted on the chart.
How do I use it?
As shown below, the cross overs are very easy to see. The Stoploss "should" be set at the most recent swing high or low prior to the MA Cross.
The dotted yellow line must cross above or below the thick mutli-colored line in order to be considered valid.
As seen in the screenshot below, an optional input setting turns ON / OFF additional Moving Average "Lines" and plots them on the chart. In addition, the indicator color fills between the moving averages based on Bullish or Bearish movement. If the lines are in continuity, then the color will be either RED or GREEN depending on the market sentiment (bull or bear).
The total number of Moving Averages listed in the table can be manually adjusted in the settings by the user. The table is small and see-through so it works on mobile devices as well and allows the user to still see the candles easily. Simply double clicking on the table will bring up the settings.
As shown below, the table can be relocated to a position acceptable to the user if it is in the way. This option is available under input settings.
I hope this indicator proves useful for you and your trading style. If you have any suggestions please let me know.
EMA Crossover Strategy ExampleThis is a script written as an example of how to build a simple strategy with user-defined inputs based on a simple Moving Average crossover.
--
This indicator is used for backtesting Moving Average crossover strategies (only for long trades).
A "short" and "long" moving average period and calculation method (the "smoothing type") are user-adjustable. The trade is triggered when the "short" moving average crosses over the "long" moving average.
A third customizable moving average is provided which is used as a trigger to exit the trade when the *close* of a candle crosses below this "exit" moving average. Again the period and smoothing type are user-adjustable.

Smart Trend Cloud + Dynamic Gate (V 2.3)Smart Trend Cloud + Dynamic Gate
The Smart Trend Cloud + Dynamic Gate is a comprehensive trend-following system designed to filter out market noise and identify high-probability trend entries. Unlike simple Moving Average crossovers which often fail in ranging markets, this indicator employs a multi-stage validation system (The "Gate") combining Volume, Momentum, and Volatility filters to ensure you only trade when the market has conviction.
Key Features:
> Multi-Type Trend Cloud: Choose between HMA (Hull Moving Average), EMA, or ZeroLag EMA to define the trend baseline.
> The "Dynamic Gate" Filter: A crossover alone does not trigger a signal. The move must be validated by Relative Volume or MACD Histogram momentum within a specific window.
> Choppiness Suppression: Integrated ADX filter turns the candles gray during low-volatility consolidation zones to prevent over-trading.
> Stretch Bands: Optional ATR-based bands to highlight when price is over-extended from the mean.
> Live Dashboard: A table on the chart displaying current Trend State, Relative Volume strength, and ADX values.
How logic Works
1. Trend Definition & The Cloud The core trend is defined by the relationship between a Fast and Slow Moving Average.
Visuals: The space between these MA's forms the "Cloud". The cloud color transparency adjusts dynamically based on the strength of the trend (the spread between the MAs).
MA Options:
HMA: Best for scalping (1m/5m) due to low lag.
ZeroLag EMA: Custom calculation to reduce latency while retaining smoothness.
EMA: Standard trend following.
2. The Entry Gate (Validation) To avoid false signals during "whipsaw" price action, this script uses a logic gate. When a MA crossover occurs, it enters a "Pending" state. It only confirms a BULL or BEAR state if one of the following conditions is met within Gate Window bars:
Volume Spike: Relative Volume (Current Vol / Avg Vol) is greater than the defined threshold (default 1.2x).
Momentum Shift: The MACD Histogram confirms the direction of the trend.
3. Consolidation Filter The script calculates the ADX (Average Directional Index). If the ADX is below the Min ADX Strength threshold (default 20), the market is considered "Choppy."
Visual: Bars turn Gray.
Logic: Trend signals are suppressed until volatility expands.
4. Visual Dashboard A panel is located in the top-right corner providing real-time data:
Trend: Current State (Bull, Bear, or Chop).
Vol: Current Relative Volume (Green if > 1.0).
ADX: Current Trend Strength value.
Settings:
Trend Settings:
Adjust MA types and lengths to fit your timeframe.
Entry Gate: Toggle the Volume/Price gate on/off and adjust the Relative Volume requirement.
Consolidation: Enable/Disable the ADX filter to see all signals or only high-strength ones.
Visuals: Toggle the Cloud, Dashboard, or "Stretch Bands" (ATR bands) to declutter your chart.
Recommended Settings by Timeframe
Since different timeframes require different sensitivities to noise, here are the optimized settings for the Smart Trend Cloud:
⚡ 5 Minute Chart (Scalping)
Best for: Catching quick intraday momentum bursts while filtering chop.
MA Type: HMA (Hull Moving Average for speed)
Fast Length: 9
Slow Length: 21
Min Relative Volume: 1.3 (Requires higher volume to confirm entry)
Min ADX: 25 (Stricter chop filter)
⏱️ 15 Minute Chart (Intraday Swing)
Best for: Day trading with a balance of speed and stability.
MA Type: ZeroLag EMA (Reduces noise better than HMA)
Fast Length: 10
Slow Length: 30
Min Relative Volume: 1.2
Min ADX: 20
hrs 1 Hour Chart (Short-Term Swing)
Best for: Capturing the trend of the week.
MA Type: EMA or ZeroLag EMA
Fast Length: 12
Slow Length: 26 (Classic MACD correlation)
Min Relative Volume: 1.1
Min ADX: 20
📅 1 Day Chart (Position Trading)
Best for: Long-term trends and "Golden Cross" style entries.
MA Type: EMA (Standard Institutional Moving Average)
Fast Length: 20
Slow Length: 50
Min Relative Volume: 1.2
Min ADX: 15 (Allows for earlier entries on major trend shifts)
Alerts:
The script includes built-in alertcondition events for:
Trend Start: Bull (Valid trend detected after filtering).
Trend Start: Bear (Valid trend detected after filtering).
Access & Authorization
This is an Invite-Only script.
Buy Sell SignalBuy Sell Signal - EMA Crossover with Dynamic Risk Management
OVERVIEW
This indicator combines a dual EMA crossover system with ATR-based dynamic stop loss and take profit levels to provide complete trade management signals. Unlike basic EMA crossover scripts, this tool automatically calculates and displays entry points, stop losses, and take profit targets based on market volatility, offering traders a complete trading framework in a single indicator.
HOW IT WORKS
The indicator uses three core components working together:
Trend Detection: A fast EMA (default 5) and slow EMA (default 13) identify trend direction. When the fast EMA crosses above the slow EMA, it signals bullish momentum; when it crosses below, it signals bearish momentum.
Entry Validation: Optional candle confirmation filter ensures the crossover is accompanied by a bullish/bearish candle close, reducing false signals in choppy markets.
Risk Management: Uses ATR (Average True Range, default 14 periods) to calculate:
Stop Loss: Positioned below/above recent swing low/high minus ATR multiplier (default 0.5x)
Take Profit: Calculated using customizable risk-reward ratio (default 3:1)
KEY FEATURES
✅ Automatic Position Tracking: Monitors active trades and displays current position status (LONG/SHORT/No position)
✅ Visual Trade Management: Shows entry price (white dashed line), stop loss (red line), and take profit (green line) in real-time
✅ Trade Outcome Signals: Displays clear markers when TP is hit (🎯), SL is triggered (❌), or position is invalidated by opposite signal
✅ Information Dashboard: Live table showing entry price, SL, TP, and actual R:R ratio
✅ Smart Position Invalidation: Automatically closes and invalidates previous positions when opposite trend signal appears
✅ Customizable Alerts: Five alert conditions for BUY/SELL signals, TP hits, SL triggers, and invalidations
INPUTS
Fast EMA Length (default 5): Responsive to recent price action
Slow EMA Length (default 13): Defines broader trend direction
ATR Period (default 14): Volatility measurement period
SL Multiplier (default 0.5): Distance from swing point to stop loss
Risk:Reward Ratio (default 3.0): Target profit relative to risk
Candle Confirmation (default ON): Requires bullish/bearish candle on crossover
HOW TO USE
Apply the indicator to your chart (works on all timeframes)
Adjust EMA periods based on your trading style (shorter for scalping, longer for swing trading)
Set your preferred risk-reward ratio
Enable alerts for automated notifications
When a BUY/SELL signal appears, the indicator automatically calculates and displays your complete trade plan
Monitor the information table for live position updates
Exit when TP is reached or SL is triggered
TRADING METHODOLOGY
This script implements a momentum-following strategy based on exponential moving average crossovers, enhanced with volatility-adjusted risk parameters. The ATR-based stop loss adapts to market conditions—wider stops in volatile markets, tighter stops in calm markets. The position invalidation feature prevents traders from holding outdated positions when market sentiment shifts.
BEST PRACTICES
Use on trending markets for best results
Higher timeframes (4H, Daily) produce fewer but more reliable signals.
For scalpe use 5 and 15 minutes(Risk).
Consider market context and fundamental factors alongside signals
Adjust ATR multiplier based on asset volatility
Test different EMA combinations for your preferred instruments
ORIGINALITY
While EMA crossover systems are common, this script's value lies in its complete integration of entry logic, dynamic risk management, position tracking, and automated invalidation—features typically requiring multiple separate indicators. The ATR-based stop loss calculation and automatic R:R visualization provide practical trade execution guidance that basic crossover indicators lack.
Important Notes:
This indicator does not guarantee profitable trades
Always practice proper risk management
Backtest settings on historical data before live trading
Past performance does not indicate future results

Smart Trend Signals [QuantAlgo]🟢 Overview
The Smart Trend Signals indicator is created to address a fundamental challenge in technical analysis: generating timely trend signals while adapting to varying market volatility conditions. The indicator distinguishes itself by employing volatility-adjusted calculations that automatically modify signal sensitivity based on current market conditions, rather than using fixed parameters that perform inconsistently across different market environments. By processing Long and Short signals through separate dynamic calculation engines, each optimized for its respective directional bias, the indicator reduces the common issue of delayed or conflicting signals that plague many traditional trend-following tools. Additionally, the integration of linear regression-based trend confirmation adds another layer of signal validation, helping to filter market noise while maintaining responsiveness to genuine price movements. This adaptive approach makes the indicator practical for both traders and investors across different asset classes and timeframes, from short-term forex/crypto scalping to long-term equity position analysis.
🟢 How It Works
The indicator uses a straightforward calculation process that combines volatility measurement with momentum detection to generate directional signals. The system first calculates Average True Range (ATR) over a user-defined period to measure current market volatility. This ATR value is then multiplied by the Smart Trend Multiplier setting to create dynamic reference levels that expand during volatile periods and contract during calmer market conditions.
For signal generation, the indicator maintains separate calculation paths for Long/Buy and Short/Sell opportunities. Long signals are generated when price moves above a dynamically calculated level below the current price, confirmed by an exponential moving average crossover in the same direction. Short signals work in reverse, triggering when price moves below a calculated level above the current price, also requiring EMA confirmation. This dual-path approach allows each signal type to operate with parameters suited to its directional bias.
🟢 How to Use
Long Signals (Green Labels): Appear as "Long" labels below price bars when the indicator detects upward price momentum above the calculated reference level, confirmed by EMA crossover. These signals identify moments when price action demonstrates bullish characteristics based on the volatility-adjusted calculations.
Short Signals (Red Labels): Display as "Short" labels above price bars when downward price momentum below the reference level is detected and confirmed by EMA crossover. These signals highlight instances where price action exhibits bearish characteristics according to the indicator's mathematical framework.
Customizable Bar Coloring: This feature colors individual price bars to match the current signal direction. When enabled, each bar reflects the indicator's current directional bias, creating a continuous visual representation of trend periods across the chart timeline.
Built-in Alert System: Provides automatic notifications for new signals with detailed exchange and ticker information. The alert system monitors the indicator's calculations continuously and triggers notifications when new long or short signals are generated, allowing traders/investors to track multiple instruments simultaneously.
🟢 Pro Tips for Trading and Investing
→ Parameter Adjustment: Higher Smart Trend Multiplier settings generate fewer signals that may be more selective, while lower settings produce more frequent signals that may include more false positives. Test different settings to find what works for your trading style and market conditions.
→ Timeframe Analysis: Using higher timeframes for general trend direction and lower timeframes for entry timing is a common approach.
→ Risk Management: No indicator eliminates the need for proper risk management. Use appropriate position sizing and stop-loss strategies regardless of signal quality or frequency.
→ Market Conditions: The indicator may perform differently in trending versus ranging markets. Frequent signal changes might indicate choppy conditions. Backtest and paper trade before risking real capital.
